

A few months ago, Microsoft Corp. NASDAQ: MSFT it was trading at a high of $542. At the time, many analysts were whispering that many tech stocks were overvalued.
Therefore, it should come as no surprise that MSFT has come down from those heights. However, not many analysts were expecting this kind of discount from MSFT. In fact, at the beginning of April, the stock was trading around $357, erasing all of its gains over a 12-month period.
While MSFT is up nearly 5% over the past three months, even a strong earnings report wasn’t enough to sustain momentum higher. Included in that report was the announcement that Microsoft’s AI business had reached an average of $37 billion in annual revenue, up 123% from last year.
It was the first time the company has revised this figure since it reported a run rate of $13 billion in January 2025.
The News May Swing In Microsoft’s Favor
With earnings season in the rearview mirror, investors are left with a rare disconnect between a company that performs well based on fundamentals and a stock price that could provide a compelling entry point.
However, that means investors can still find MSFT at an attractive price. The stock trades at about 25x forward earnings. That’s about 30% below its five-year average of 34x.
Here are three catalysts that can make that happen.
First, a restructuring of the OpenAI deal, announced days before earnings, ended Microsoft’s royalty payments to OpenAI while locking in IP rights through 2032 and allowed OpenAI to serve customers on any cloud provider. Wedbush’s Daniel Ives called the restructuring “good,” raising his price target to $575, and flagged that Microsoft will now receive about $6 billion from OpenAI by 2026, compared to the $4 billion previously expected.
Second, Copilot’s monetization story is sharp. Copilot’s weekly engagement is now on par with Outlook, and the Microsoft 365 E7 bundle became generally available on May 1. Microsoft projects higher growth in total subscribers in the June quarter compared to an addition of nearly 5 million recorded in March.
Third, as of this writing, the company is just two weeks away from Microsoft Build (June 2-3 in San Francisco). This is where Nadella will speak on “creating new opportunities for developers in this era of AI.” The event will include agent AI, custom model deployment, and multi-agent frameworks. These are themes that investors want to hear about.
Then there is the angle of Bill Ackman: on May 15, Pershing Square announced Microsoft as the main place to hold, where Ackman highlighted the production company 365 and the strong demand for Azure, arguing that concerns about growth are unfounded.
Chart Shows Bullish Confrontation
MSFT’s 12-month chart shows a clear moving average from August 2025 to April 2026. The stock is down about 35% in that time. That’s the momentum the Bulls have to overcome.
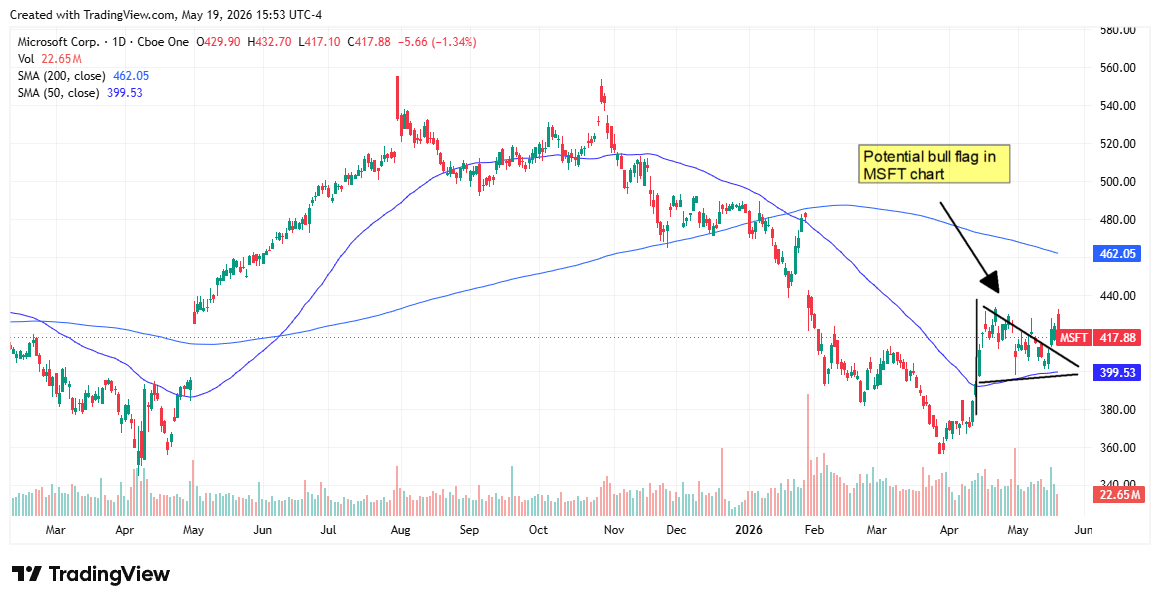
Despite the sharp recovery leg that formed with high momentum in early April, MSFT has failed to continue its upward and sideways movement at best. The volume is also low.
The conflict is that the bull flag appears to be forming. The pole was formed when MSFT rose $80 from the April low. “Flag” is the current consolidation channel, which moves slowly sideways/down with strengthening candles and decreasing volume.
Here is the problem. A bull flag occurs in the middle of a major downtrend. That makes it an anti-trend pattern, making the chances of a flag pattern correction less likely. Other concerns are:
-
The closing price on May 19 is still about $44 below the 200 SMA, which is down, which means that the bearish trend has not stopped.
-
The flag may be distributed before the other leg down.
-
That leg down could bring MSFT back to its 52-week low around $355 to $360.
However, if MSFT can make a move to close above the April high around $435, that would be a sign that the trend is reversing. If it settles well, MSFT could jump about $80 above the exit point.
That would put the stock at around $510 to $515. That coincides with the resistance area from September to October 2025. However, it is also significantly below the consensus price of $560.88.
One additional technical development to watch: the 50 SMA ($399) is rising while the 200 SMA ($462) remains bearish. If that gap continues to close and a golden cross forms—when 50 crosses above 200—it will represent a reversal in sentiment that could accelerate institutional buying and push MSFT beyond the bull flag target.
Before you consider Microsoft, you’ll want to hear this.
MarketBeat tracks Wall Street’s top and most effective research analysts and the stocks they recommend to their clients every day. MarketBeat identified five stocks that top analysts are quietly whispering to their clients to buy now before the broader market catches on… and Microsoft wasn’t on the list.
Although Microsoft currently has an Average buy rating among analysts, top analysts believe these five stocks are the best.
View Five Stocks Here
Unlock the timeless value of gold with our exclusive 2026 gold forecast report. Check out why gold remains the ultimate wealth protection investment against inflation, economic volatility, and global uncertainty. Whether you are planning for future generations or looking for a reliable asset in turbulent times, this report is your essential guide for making informed decisions.
Get This Free Report